
Introduction
As India pushes for greater oilseed self-reliance, Yashhtej Industries positions itself as a focused soybean processing player serving the edible oil and animal feed markets.
Let’s explore this upcoming IPO further:
Yashhtej Industries’ share price will be finalised post-allotment, while grey market cues through the Yashhtej Industries’ IPO GMP will likely reflect market sentiment closer to listing.
The Industry Backdrop: India’s Soyabean Market
The soybean industry is an important part of the agricultural and agri-processing sector. Soybeans are a versatile crop used for producing edible oil, soybean meal (used in animal feed), and various food products like soy flour and protein-based items. In India, soybean is one of the major oilseed crops and plays a key role in meeting domestic edible oil demand as well as supporting the livestock and poultry feed industry.
The industry is highly dependent on monsoon patterns, crop yield, and government policies related to agriculture and imports. Since soybeans are traded globally, international prices and demand also influence domestic market trends. Growth in population, rising protein consumption, and expansion of the food processing and animal feed sectors continue to support long-term demand for soybeans. However, price volatility and seasonal supply remain key challenges for industry participants.
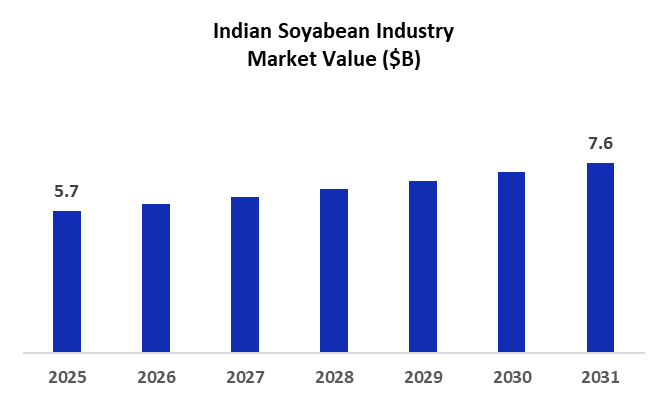
India's Soyabean Industry market size was valued at $5.7 B in 2025 and is projected to grow at a CAGR of 4.92% from 2025 to 2031.
The soybean industry is a vital link between agriculture, edible oil consumption, and animal feed demand in India. While long-term demand remains strong, profitability depends heavily on crop output, pricing trends, and efficient cost management.
Company Origin Story
Yashhtej Industries (India) Limited was incorporated in 2018 and is based in Latur, Maharashtra. The company operates in the agro-processing sector and is primarily engaged in soybean processing. Its manufacturing facility is located in the MIDC area, which helps it source raw materials from nearby agricultural regions.
The company processes soybeans to produce crude soybean oil and soybean meal. While the oil is used for edible and industrial purposes, soybean meal is mainly supplied to the animal feed industry. Yashhtej operates in a commodity-driven industry where efficiency in procurement, production, and working capital management is key to maintaining margins.
The company is engaged in the following products:
Soybean Crude Oil - Soybean crude oil is a vegetable oil extracted from soybeans through the solvent extraction process. In its crude form, the oil is not suitable for direct human consumption and must undergo further refining. The Company supplies this crude oil primarily to B2B customers engaged in the refining process, who convert it into edible oil.
Soybean De-Oiled Cake (DOC) – Soybean DOC is a by-product generated during the extraction of crude Soybean Oil, which is high in protein, making it a valuable source of plant-based protein in the animal feed industry. The Company caters exclusively to B2B customers in this segment as well.
(*It must be noted that from Dec’23 only, the company got into the Soyabean Crude oil & Soyabean DOC. Before that, the company was engaged in the trading business of soybeans and generated its revenue from that only.)
Talking about the current scenario, the company’s revenue mix has shifted over the years, with FY23 entirely dependent on soybean sales, while later years show a diversified mix between crude oil and de-oiled cakes.
In recent periods, de-oiled cakes contribute the larger share (around 57–70%), though crude oil’s contribution has been gradually increasing.
Capacity: How Much Can Yashhtej Industries Really Make?
The table shows a great improvement in capacity utilisation over the years. In FY24, utilisation was relatively low (around 41–44%), but it increased significantly to nearly 79% in FY25, indicating better operational efficiency and higher production activity.
By 6MFY26, utilisation has further improved to around 88–90%, suggesting that the company is now operating close to optimal capacity levels. This reflects stronger demand and improved plant efficiency, though it also means future growth may require additional capacity expansion.
Financial Performance
Strong revenue growth – Revenue has grown sharply from ₹12 Cr (FY23) to ₹324.8 Cr (FY25), showing rapid scale-up in operations.
Profitability turnaround – The company moved from losses in FY23 to positive EBITDA and PAT in FY24, with margins improving further in FY25 and remaining stable in 6MFY26.
Improving operational efficiency – EBITDA margin improved from negative to around 6–6.5%, and ROCE increased significantly, indicating better utilisation of capital.
Very high ROE in FY25 – ROE of 83.6% (and 305.9% in FY23 due to low equity base) suggests strong returns but also reflects leverage impact.
Cash flow improving – CFO turned positive in FY25 and remains positive in 6MFY26, indicating better cash generation.
Working capital efficiency improved – Working capital days reduced from 47 (FY24) to 23 (FY25), showing better inventory and receivable management.
High but reducing leverage – Debt-to-equity has come down from 4.2 (FY24) to 1.4 (6MFY26), though still relatively high.
Overall, the company has shown a sharp growth and profitability turnaround, with improving efficiency and reducing leverage, but it remains a relatively leveraged and rapidly scaling business.
Management + Promoter Holding
Yashhtej Industries (India) Limited’s promoters—Mr. Baswaraj Madhavrao Barge, Mr Shivling Madhavrao Barge, and Mr Suraj Shivraj Barge—collectively bring significant hands-on experience to the soybean oil extraction and agro-processing industry.
The promoters guide the company by implementing deep operational know-how in the manufacturing of soybean crude oil and de-oiled cake (DOC), with each individual bringing over seven years of specialised experience to the sector
While 3 out of 6 board members are independent directors, the governance ensures quality as the audit and remuneration committees are led by independent directors.
From a control standpoint, the promoters hold a dominant 100% stake pre-issue. Post-IPO, this stake will dilute to 65%, but promoter influence will remain firmly intact, given their high base ownership and board control.
Peer Analysis (FY25)
Smaller in size – With revenue of ₹325 Cr, Yashhtej is much smaller than KN Agri (₹1,711 Cr) and Rama Phosphates (₹744 Cr), indicating it is still in a growth stage.
Better profitability vs most peers – EBITDA margin (6.4%) is higher than KN Agri and M K Proteins, and slightly better than Rama. PAT margin (3.6%) is also the highest among all peers.
Exceptionally high ROE – ROE of 83.6% is significantly higher than peers, which may indicate strong return on equity. ROE, however, might be normalised post-fundraising via IPO.
Higher leverage risk – D/E of 2.2 is much higher than peers (mostly below 0.5), suggesting higher financial risk compared to others.
Valuation at a premium vs mid-peer – P/E of 17.5x is higher than KN Agri and Rama but lower than M K Proteins. EV/EBITDA (14.1x) is also on the higher side, indicating moderate premium pricing.
Yashhtej stands out in profitability and return ratios but carries higher debt and trades at a valuation premium compared to larger, more established peers.
Industry Specific Ratio (As per Fy25)
Yashhtej Industries shows relatively strong operating efficiency with a healthy asset turnover (10.7x) and a much shorter cash cycle (23 days) compared to peers, indicating faster working capital movement.
While its cash conversion (CFO/EBITDA) is positive but moderate, it appears more stable than some peers that are reporting negative cash conversion ratios, suggesting comparatively better cash flow discipline.
IPO Objectives
The company intends to utilise Net Proceeds of ₹ 79 Cr for the following primary objectives:
Capital Expenditure (₹ 6,388.29 Lakhs): The company plans to establish a 200 TPD Soya Solvent Refinery Plant and a 50 TPD Bottling Plant for forward integration into the edible-grade refined Soybean Oil and retail (B2C) segments. This includes civil works, procurement of machinery, and the installation of a 1200 kWp rooftop solar power project for captive consumption.
Funding Working Capital Requirements (₹ 610.57 Lakhs): Funds will be used to meet the increased operational needs of the company, which operates in a working capital-intensive industry due to raw material inventory and trade receivables.
General Corporate Purposes (₹ 950.00 Lakhs): This portion is earmarked for meeting ordinary business expenses, brand building, marketing, and other unforeseen exigencies.
Final Words
At Alpha Venture X Fund, we assess opportunities through our LMVT framework — Leadership, Moat, Valuation, and Tailwinds — enabling us to identify scalable businesses with durable fundamentals.
Leadership: Founder-led with strong industrial experience and equity retention, ensuring aligned execution and focus on scaling the IT & data centra infra business.
Moat: Despite having in-house manufacturing, the company lacks a moat since Soyabean Oil & DOC is a commoditised business. Putting it at risk in terms of expansion.
Tailwinds: Rise in demand for edible oil and increase in animal feed & soybean requirement at the macro level.
Valuation: The company is valued at a higher side, with P/E being at 17.5x; the EV/EBITDA ratio is also on the higher side, currently around 14.1x.
Bottom Line: Soybean oil is a commoditised product. Though the company has a very high topline growth, it must be noted that Yashhtej has been in the business of Soybean oil & DOC for only two years. With low margins & Valuation being in the fair range, Yashhtej technologies is a selective, not an automatic buy.
0
14
2
Publish Date
18 Feb 2026
Category
SME IPO
Reading Time
10 mins
Social Presence
Table Of Content
Introduction
The Industry Backdrop: India’s Soyabean Market
Capacity: How Much Can Yashhtej Industries Really Make?
Management + Promoter Holding
Industry Specific Ratio (As per Fy25)
Tags
SME IPO
SME IPO review
Yashhtej Industries (India) IPO Analysis
Office Address: MiQB, Plot 23, Sector 18, Maruti Industrial Development Area, Gurugram, Haryana 122015
Registered Office Address: 1001, Block G1B, Pocket-1, Phase-2, Samriddhi Apartments, Dwarka Sector-18B, New Delhi-110078
Email: help@alphaamc.com • Phone: +91-93-1137-8001
Alpha Ventures Private Limited
(Formerly known as Planify WealthX Pvt Ltd)
Sponsor Name
Planify Venture LLP
Investment Manager
Fund Managers
VentureX Fund I (SME)
Disclaimer
You acknowledge and confirm that by accessing the website, you are seeking information relating to the organisation of your own accord and that there has been no form of solicitation, advertisement or inducement by the organisation. Any part of the content is not, and should not be construed as, an offer or solicitation to buy or sell any securities or make any investments or any products. No material/information provided on this website should be construed as investment advice. Any action on your part on the basis of the said content is at your own risk and responsibility.
Financial Documents
Policies
© 2024–2025 Alpha. All rights reserved, Built with ❤️ in India